Monitor Training ↗
noOriginal Documentation
Documentation Index#
Fetch the complete documentation index at: https://docs.fireworks.ai/llms.txt Use this file to discover all available pages before exploring further.
Track RFT job progress and diagnose issues in real-time
Once your RFT job is running, the Fireworks dashboard provides comprehensive monitoring tools to track progress, inspect individual rollouts, and debug issues as they arise.
Accessing the monitoring dashboard#
After creating your RFT job, you’ll receive a dashboard link in the CLI output:
Dashboard Links:
   RFT Job: https://app.fireworks.ai/dashboard/fine-tuning/reinforcement/abc123
Click this link or navigate manually:
- Go to Fireworks Dashboard
- Click Fine-Tuning in the sidebar
- Select your job from the list
Understanding the overview#
The main dashboard shows your job’s current state and key metrics.
Job status#
Action: None needed. Job will start automatically when resources become available.
Duration: Typically 1-2 minutes
Action: None needed. If validation fails, you’ll receive specific error messages about issues in your dataset.
Action: Monitor metrics and rollout quality. This is when you’ll watch reward curves improve.
Action: Review final metrics, then deploy your model.
Action: Check error logs and troubleshooting section below. Common causes include evaluator errors, resource limits, or dataset issues.
Action: Review partial results if needed. Create a new job to continue training.
Action: This typically indicates an issue with your evaluator or training setup. Check that:
- Your evaluator is returning varied scores (not all 0s or all 1s)
- The reward function can distinguish between good and bad outputs
- The model is actually generating different responses
Review the troubleshooting section below for common causes.
Key metrics at a glance#
The overview panel displays:
- Elapsed time: How long the job has been running
- Progress: Current epoch and step counts
- Reward: Latest mean reward from rollouts
- Model: Base model and output model names
Training metrics#
Reward curves#
The most important metric in RFT is the reward curve, which shows how well your model is performing over time.
What to look for:
Upward trend - Model is learning and improving
Plateauing - Model may have converged; consider stopping or adjusting parameters
Decline - Potential issue with evaluator or training instability
Spikes - Could indicate noisy rewards or outliers in evaluation
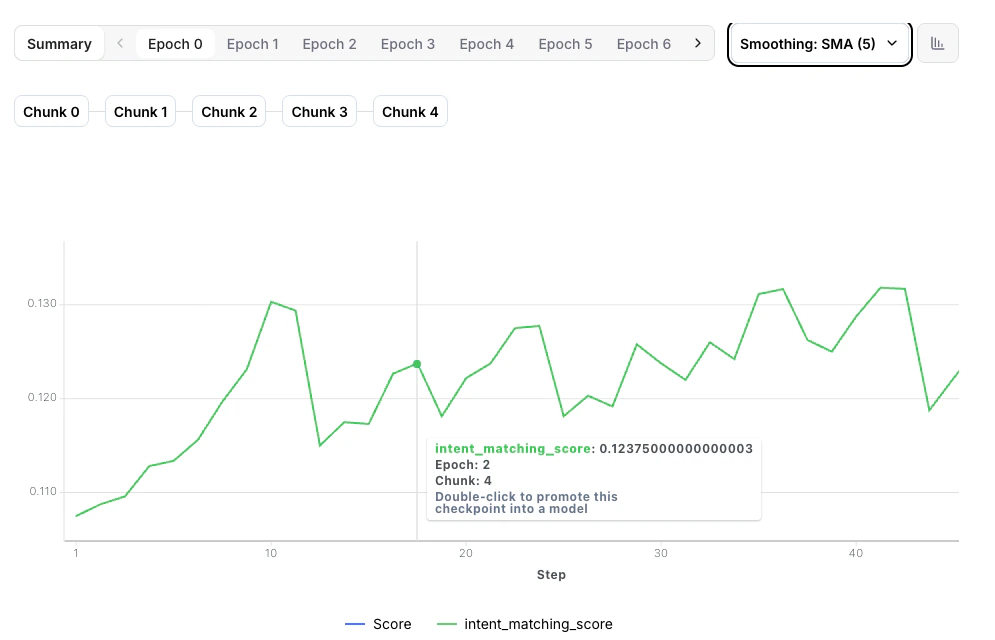
Healthy training shows steady reward improvement. Don’t worry about minor fluctuations—focus on the overall trend.
Training loss#
Loss measures how well the model is fitting the training data:
- Decreasing loss - Normal learning behavior
- Increasing loss - Learning rate may be too high
- Flat loss - Model may not be learning; check evaluator rewards
Evaluation metrics#
If you provided an evaluation dataset, you’ll see validation metrics:
- Eval reward: Model performance on held-out data
- Generalization gap: Difference between training and eval rewards
Large gaps between training and eval rewards suggest overfitting. Consider reducing epochs or adding more diverse training data.
Inspecting rollouts#
Understanding individual rollouts helps you verify your evaluator is working correctly and identify quality issues.
Rollout overview table#
Click any Epoch in the training timeline, then click the table icon to view all rollouts for that step.
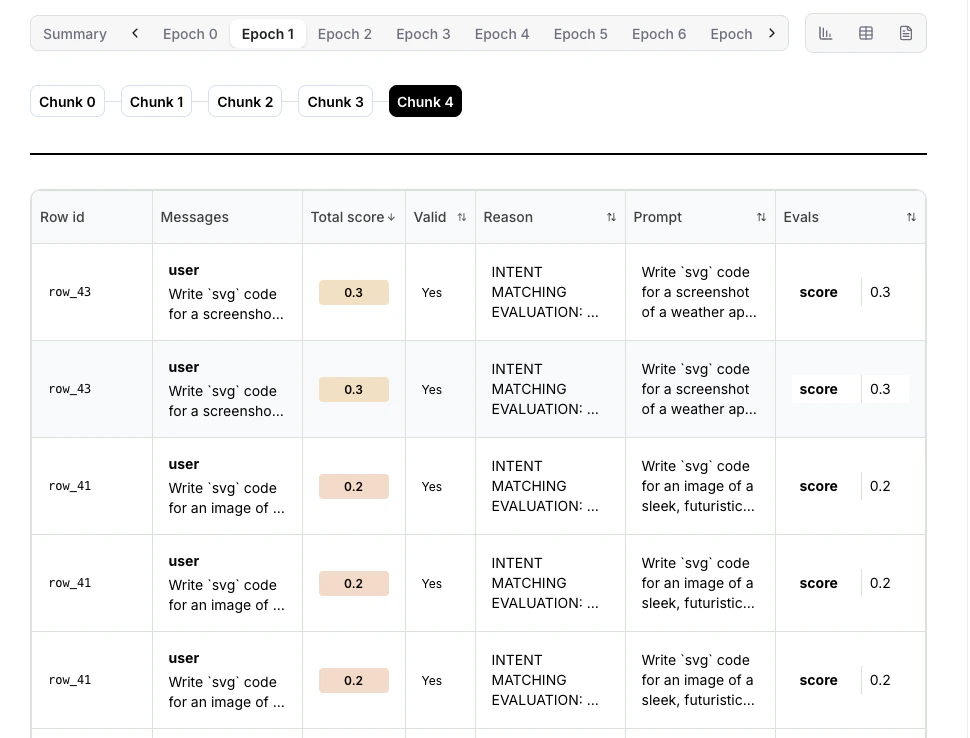
The table shows:
- Row ID: Unique identifier for each dataset row used in this rollout
- Prompt: The input prompt sent to the model
- Messages: The model’s generated response messages
- Valid: Whether the rollout completed successfully without errors
- Reason: Explanation if the rollout failed or was marked invalid
- Score: Reward score assigned by your evaluator (0.0 to 1.0)
What to check:
- Most rollouts succeeding (status: complete)
- Reward distribution makes sense (high for good outputs, low for bad)
- Many failures indicate evaluator issues
- All rewards identical may indicate evaluator is broken
Individual rollout details#
Click any row in the rollout table to see full details:
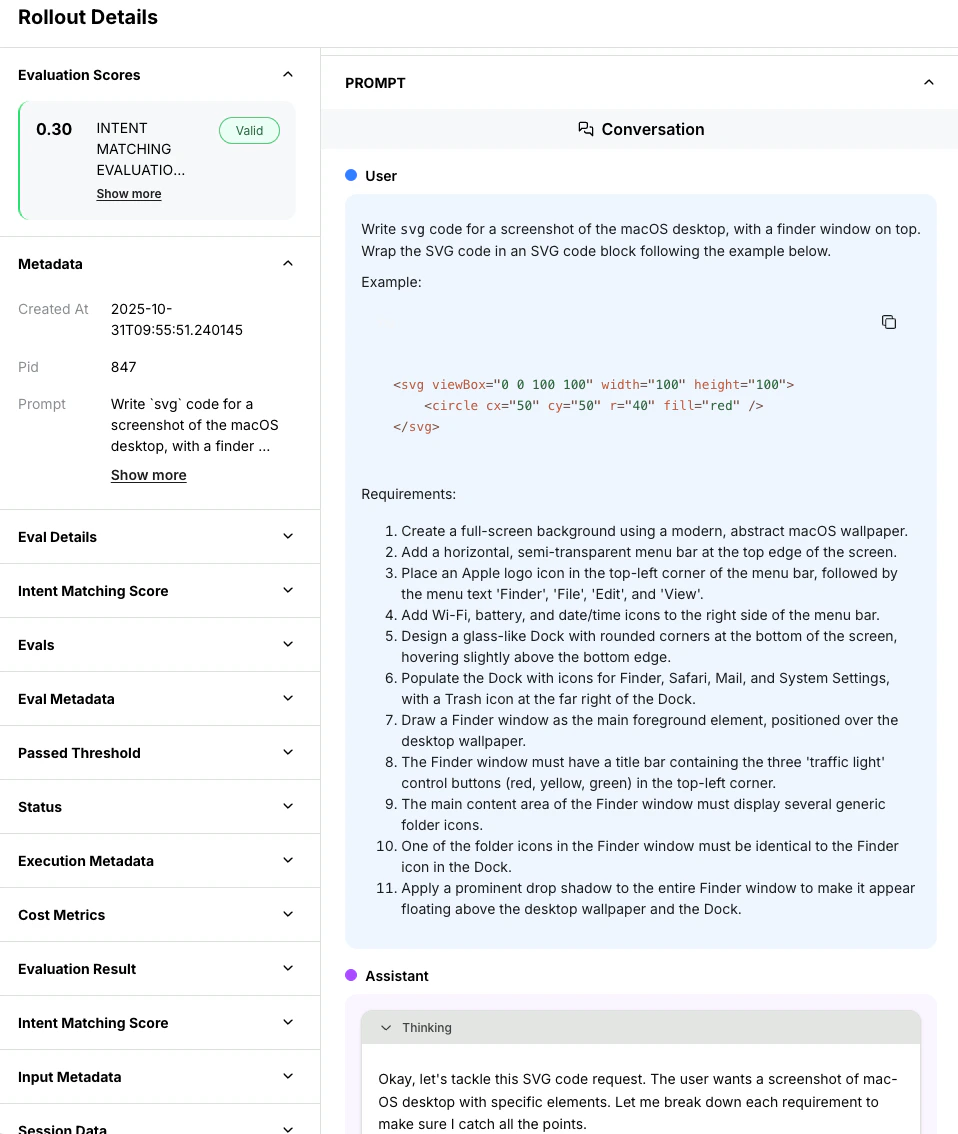
You’ll see:
- Full prompt: Exact messages sent to the model
- Model response: Complete generated output
- Evaluation result: Reward score and reasoning (if provided)
- Metadata: Token counts, timing, temperature settings
- Tool calls: For agentic rollouts with function calling
Copy and paste model outputs to test them manually. For example, if you’re training a code generator, try running the generated code yourself to verify your evaluator is scoring correctly.
Quality spot checks#
Regularly inspect rollouts at different stages of training:
Early training (first epoch):
- Verify evaluator is working correctly
- Check that high-reward rollouts are actually good
- Ensure low-reward rollouts are actually bad
Mid-training:
- Confirm model quality is improving
- Look for new strategies or behaviors emerging
- Check that evaluator isn’t being gamed
Late training:
- Verify final model quality meets your standards
- Check for signs of overfitting (memorizing training data)
- Ensure diversity in responses (not all identical)
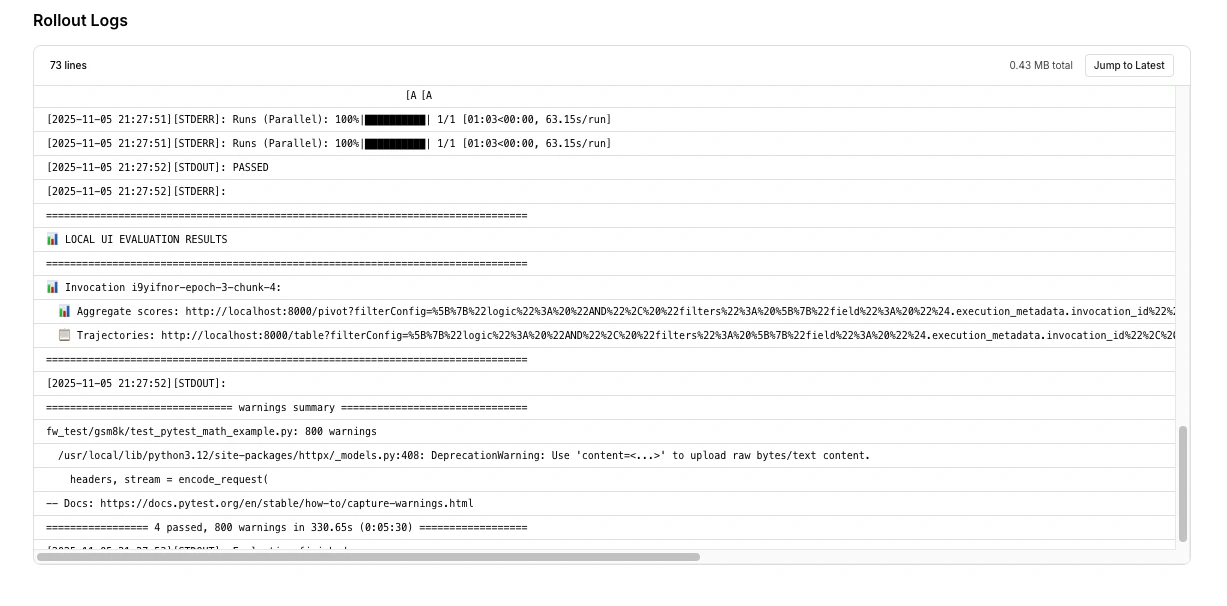
Live logs#
Real-time logs show what’s happening inside your training job.
Accessing logs#
Click the Logs icon next to the table icon to view real-time logs for your training job.
Using logs for debugging#
When things go wrong, logs are your first stop:
- Filter by error level: Focus on
[ERROR]and[WARNING]messages - Search for rollout IDs: Track specific rollouts through their lifecycle
- Look for patterns: Repeated errors indicate systematic issues
- Check timestamps: Correlate errors with metric changes
Training diagnostics#
Available in the managed flow#
The managed RFT dashboard provides:
- Reward curves: Mean reward over training steps
- Training loss: Policy loss over time
- Rollout inspection: Individual rollouts with scores, messages, and metadata
Traces page#
The Traces page in the Fireworks dashboard provides per-rollout execution traces, including timing, token counts, and evaluation results. Trace data can be downloaded for offline analysis using the download button on the Traces page.
Metrics not directly surfaced#
The following diagnostics are not directly surfaced in the managed RFT dashboard today:
- Filtering rates: How many zero-variance groups were dropped per iteration
- Effective batch size: Actual number of training groups after filtering
- Advantage magnitude and distribution: Per-step advantage statistics
- KL divergence: Distance between the current policy and the reference model
- Per-token importance sampling ratios: Clipping frequency and magnitude
These metrics can be partially inferred from trace data and rollout inspection. For richer per-step diagnostics, consider using the Training API, which gives you full Python control over the training loop and allows you to log any metric you need.
Common issues and solutions#
Possible causes:
- Evaluator always returning 0 or very low scores
- Model outputs not matching expected format
- Task too difficult for base model
Solutions:
- Inspect rollouts to verify evaluator is working:
- Check that some rollouts get high rewards
- Verify reward logic makes sense
- Test evaluator locally on known good/bad outputs
- Simplify the task or provide more examples
- Try a stronger base model
Possible causes:
- Learning rate too high causing training instability
- Model found an exploit in the evaluator (reward hacking)
- Catastrophic forgetting
Solutions:
- Stop training and use the last good checkpoint
- Restart with lower learning rate (e.g.,
--learning-rate 5e-5) - Review recent rollouts for reward hacking behavior
- Improve evaluator to be more robust
Possible causes:
- Evaluator code errors
- Timeout too short for evaluation
- External API failures (for remote evaluators)
- Resource exhaustion
Solutions:
- Check error logs for specific error messages
- Test evaluator locally to reproduce errors
- Increase
--rollout-timeoutif evaluations need more time - Add better error handling in evaluator code
- For remote evaluators: check server health and logs
Possible causes:
- Learning rate too high
- Conflicting reward signals
- Numerical instability
Solutions:
- Reduce learning rate by 2-5x
- Check that rewards are consistent (same prompt gets similar rewards)
- Verify rewards are in valid range [0, 1]
- Consider reducing batch size
Possible causes:
- Temperature too low (near 0)
- Model found one high-reward response and overfit to it
- Evaluator only rewards one specific output
Solutions:
- Increase
--temperatureto 0.8-1.0 - Make evaluator more flexible to accept diverse good answers
- Use more diverse prompts in training data
- Reduce epochs to prevent overfitting
Possible causes:
- Remote server slow or overloaded
- Network latency issues
- Evaluator not logging completion correctly
Solutions:
- Check remote server logs for errors
- Verify server is logging
Status.rollout_finished() - Increase
--rollout-timeoutto allow more time - Scale remote server to handle concurrent requests
- Optimize evaluator code for performance
Performance optimization#
Speeding up training#
If training is slower than expected:
- Profile your evaluator code to find bottlenecks
- Cache expensive computations
- Use batch processing for API calls
- Add timeouts to prevent hanging
For remote evaluators:
- Add more worker instances to handle concurrent rollouts
- Use faster machines (more CPU, memory)
- Optimize network connectivity to Fireworks
Target: Evaluations should complete in 1-5 seconds per rollout.
- Decrease
--n(e.g., from 8 to 4 rollouts per prompt) - Reduce
--max-tokensif responses don’t need to be long - Lower temperature slightly to speed up sampling
Caution: Too few rollouts (n < 4) may hurt training quality.
Cost optimization#
Reduce costs without sacrificing too much quality:
- Start small: Experiment with
qwen3-0p6bbefore scaling to larger models - Reduce rollouts: Use
--n 4instead of 8 - Shorter responses: Lower
--max-tokensto minimum needed - Fewer epochs: Start with 1 epoch, only add more if needed
- Efficient evaluators: Minimize API calls and computation
Stopping and resuming jobs#
Stopping a running job#
If you need to stop training:
- Click Cancel Job in the dashboard
- Or via CLI:
firectl rftj delete <job-id>
The model state at the last checkpoint is saved and can be deployed.
Cancelled jobs cannot be resumed. If you want to continue training, create a new job starting from the last checkpoint.
Using checkpoints#
Checkpoints are automatically saved during training. To continue from a checkpoint:
eval-protocol create rft \
  --warm-start-from accounts/your-account/models/previous-checkpoint \
  --output-model continued-training
This is useful for:
- Extending training after early stopping
- Trying different hyperparameters on a trained model
- Building on previous successful training runs
Comparing multiple jobs#
Running multiple experiments? Compare them side-by-side:
- Navigate to Fine-Tuning dashboard
- Select multiple jobs using checkboxes
- Click Compare
This shows:
- Reward curves overlaid on same graph
- Parameter differences highlighted
- Final metrics comparison
- Training time and cost comparison
Use consistent naming for experiments (e.g., math-lr-1e4, math-lr-5e5) to make comparisons easier.
Exporting metrics#
For deeper analysis or paper writing:
Via dashboard#
- Click Export button in job view
- Choose format: CSV, JSON
- Select metrics to export (rewards, loss, rollout data)
Via API#
import requests

response = requests.get(
    f"https://api.fireworks.ai/v1/accounts/{account}/reinforcementFineTuningJobs/{job_id}/metrics",
    headers={"Authorization": f"Bearer {api_key}"}
)

metrics = response.json()
Weights & Biases integration#
If you enabled W&B when creating the job:
eval-protocol create rft \
  --wandb-project my-experiments \
  --wandb-entity my-org \
  ...
All metrics automatically sync to W&B for advanced analysis, comparison, and sharing.
Best practices#
- Verify evaluator is working correctly
- Confirm rewards are in expected range
- Catch configuration errors early
Don’t wait until training completes to discover issues.
- Manually verify high-reward outputs are actually good
- Check low-reward outputs are actually bad
- Look for unexpected model behaviors
This catches evaluator bugs and reward hacking.
    # Save to file for reproducibility
    echo "eval-protocol create rft --base-model ... --learning-rate 5e-5 ..." > best_config.sh
    ```

Makes it easy to reproduce results or share with team.
  </Accordion>

  <Accordion title="Use meaningful names">
Name jobs descriptively:

* Good: `math-solver-llama8b-temp08-n8`
* Bad: `test1`, `try2`, `final-final`

Future you will thank you when comparing experiments.
  </Accordion>

  <Accordion title="Document experiments">
Keep notes on what worked and what didn't:

* Hypothesis for each experiment
* Parameters changed
* Results and insights
* Next steps

Build institutional knowledge for your team.
  </Accordion>
</AccordionGroup>

## Next steps

<span class="card-group-start" data-cols="2"></span>
  <span class="card-start" data-card-title="Deploy your model" data-card-icon="rocket" data-card-href="/fine-tuning/deploying-loras"></span>
Once training completes, deploy your fine-tuned model for inference
  <span class="card-end"></span>

  <span class="card-start" data-card-title="Parameter tuning" data-card-icon="sliders" data-card-href="/fine-tuning/parameter-tuning"></span>
Learn how to adjust parameters for better results
  <span class="card-end"></span>

  <span class="card-start" data-card-title="Evaluator best practices" data-card-icon="lightbulb" data-card-href="/fine-tuning/evaluators"></span>
Improve your reward functions based on training insights
  <span class="card-end"></span>

  <span class="card-start" data-card-title="Launch another job" data-card-icon="play" data-card-href="/fine-tuning/cli-reference"></span>
Start a new experiment using the CLI
  <span class="card-end"></span>
<span class="card-group-end"></span>