Parallel coordinates ↗
noSummary: Compare results across machine learning experiments
Original Documentation
Documentation Index#
Fetch the complete documentation index at: https://docs.wandb.ai/llms.txt Use this file to discover all available pages before exploring further.
Compare results across machine learning experiments
Parallel coordinates charts summarize the relationship between large numbers of hyperparameters and model metrics at a glance.
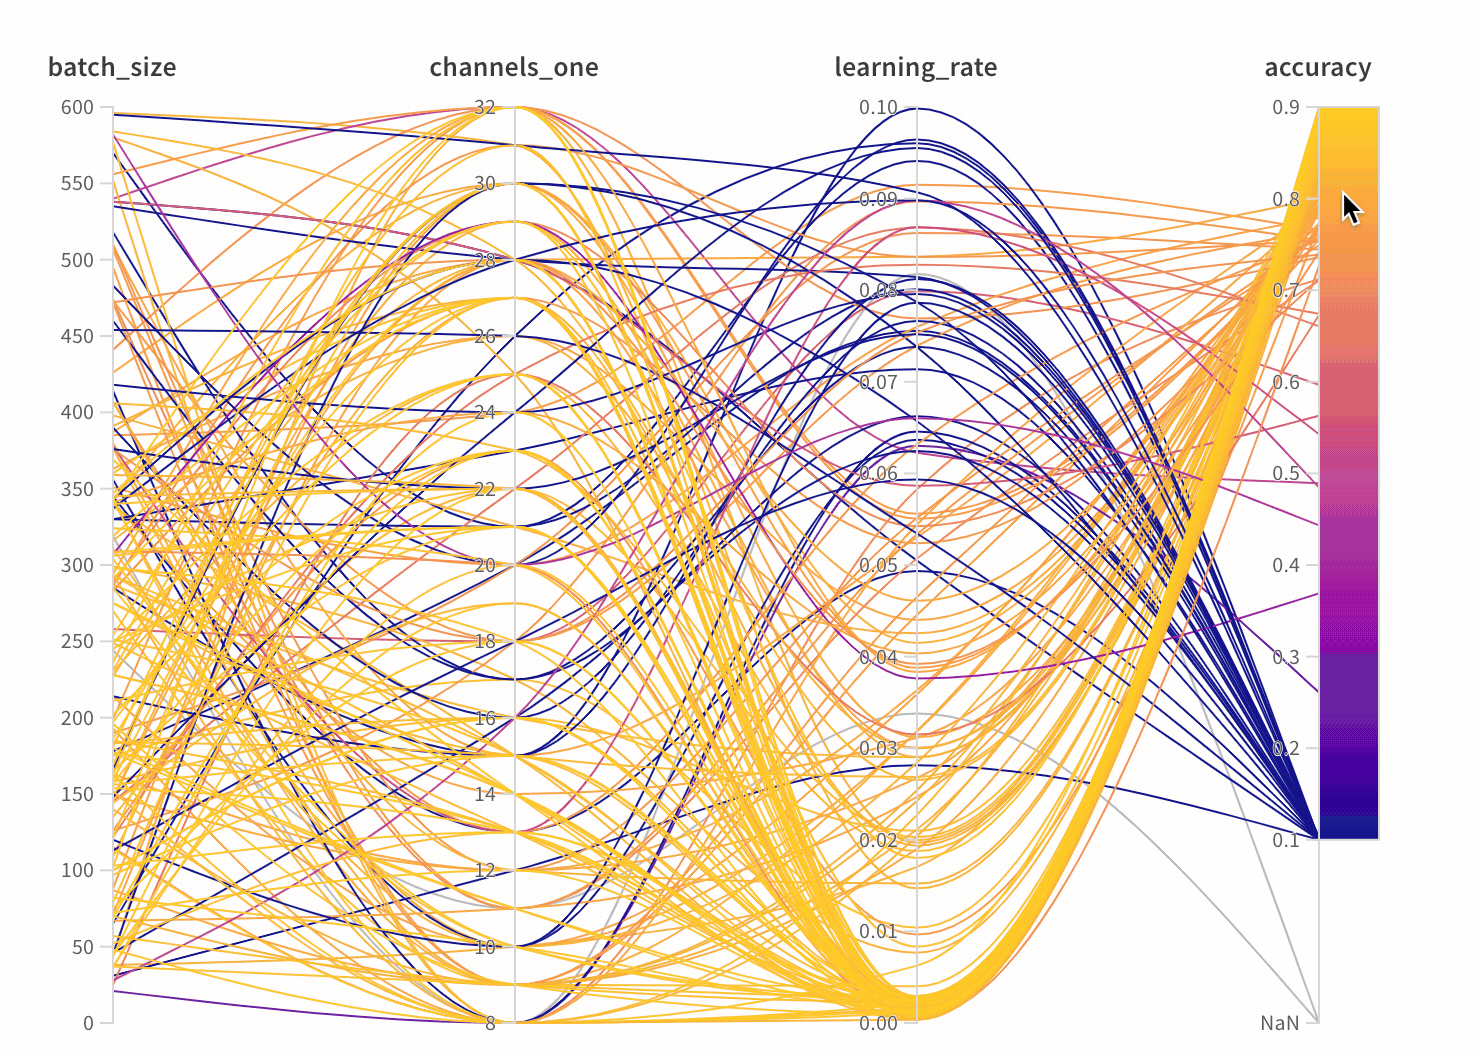
- Axes: Different hyperparameters from
wandb.Run.configand metrics fromwandb.Run.log(). - Lines: Each line represents a single run. Mouse over a line to see a tooltip with details about the run. All lines that match the current filters will be shown, but if you turn off the eye, lines will be grayed out.
Create a parallel coordinates panel#
- Go to the landing page for your workspace
- Click Add Panels
- Select Parallel coordinates
Panel Settings#
To configure the panel, click the edit button in the upper right corner of the panel.
- Tooltip: On hover, a legend shows up with info on each run
- Titles: Edit the axis titles to be more readable
- Gradient: Customize the gradient to be any color range you like
- Log scale: Each axis can be set to view on a log scale independently
- Flip axis: Switch the axis direction— this is useful when you have both accuracy and loss as columns
Link last verified
June 7, 2026.
View original ↗
Source: Weights & Biases Docs
Link last verified: 2026-03-04